Pipeline Design
CRM reporting
Learn how to define CRM sales reports, choose the right deal population and calculation, and check figures before sharing them.
CRM reporting turns customer and deal records into answers a sales team can use. Start with the decision: which opportunities need attention, what has been won, or what might close in a future period? Then define the records, date and calculation behind the figure. Readers need to know what each number includes.
Top CRM Tools for Australian Businesses
- HubSpot CRMBest for small-to-mid businesses; strong analytics suite; free tier available
- Salesforce CRMEnterprise-grade; widely used across Australian industries; robust reporting and forecasting
- NetSuite ERP + CRMScalable for growing Australian SMEs; integrates finance and operations with CRM
- Capterra Australia DirectoryCurated list of CRM software options; includes user reviews and comparisons
Start with the question
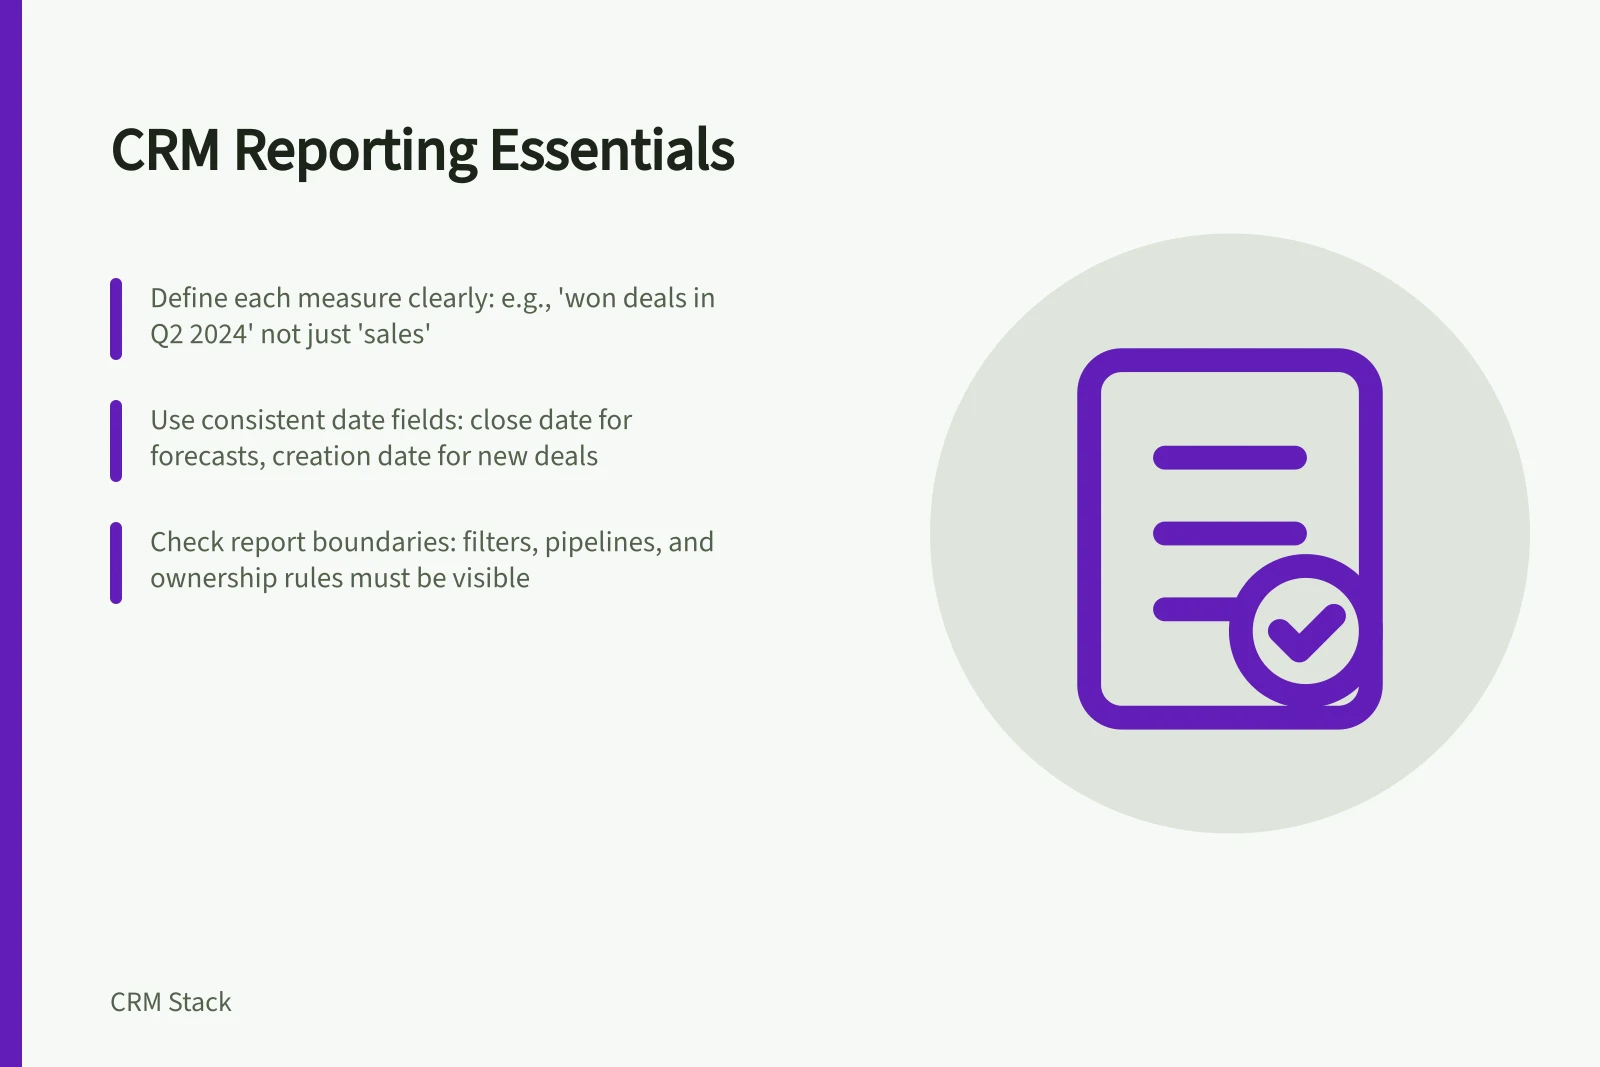
A total labelled “sales” might mean the value of open deals, deals marked won, or a forecast. Name each measure to reflect its purpose.
| Question | Useful measure | Boundary to state |
|---|---|---|
| How much potential work is open? | Value of eligible open deals | Which pipelines, stages and dates are included? |
| What has sales recorded as won? | Value of deals marked won in the period | Is this booked deal value rather than revenue recognised or cash received? |
| What may close this period? | A defined forecast | Does it use full amounts, weighted amounts or a submitted judgement? |
| Where does work need review? | Open deals meeting an agreed exception rule | Is the rule based on a past close date, a missing next action or another condition? |
These are reporting choices, not universal CRM definitions. Record the agreed meaning beside each report. A closed-won deal amount should not be presented as cash received without reconciliation to the financial records.
Build from a dependable deal population
Decide what one row represents. For a deal-value report, identify each opportunity once and check its amount, currency, status, owner and relevant date. If the business uses several pipelines, state which are in scope. Separate opportunities under one customer when they represent separate purchase decisions.
Check whether the fields can support the question. A blank close date may exclude a deal from a period view, and an outdated owner can place it under the wrong team.
A deal left open after a lost decision can overstate the open pipeline. Assign such records for correction instead of hiding them with an unexplained filter.
Choose a date that matches the event. Deals created this month answer a different question from deals expected to close this month. For a trend, say whether each point is a historical snapshot or today’s records grouped by an earlier date. A current view cannot automatically reconstruct what the team believed at an earlier review.
Define the calculation
An open-pipeline total can sum full deal amounts or probability-weighted amounts. In HubSpot, the forecast tool can display total or weighted deal amounts; its weighted amount is the Amount multiplied by Deal probability. The report and setting determine the meaning of the displayed figure. Do not assume another CRM uses the same calculation.
For a forecast, specify the period, eligible work, treatment of deals already won and who may adjust an estimate. Keep a submitted estimate distinct from a calculated pipeline figure so reviewers can explain a difference. A weighted amount is a calculation using assigned probabilities, not a promise of sales or cash.
Make report boundaries visible
A report’s filters define its population as well as its presentation. In HubSpot’s sales analytics reports, date-range filtering uses a stated date property; other available filters can segment records by owner, owner’s team or deal pipeline. Include the selected boundaries in the report’s definition so readers can interpret comparisons correctly.
When comparing teams, check whether the report groups by individual owners or their teams, and whether it also filters to selected reps or teams. Those choices answer different questions: a team-wide total and a view limited to selected people are not interchangeable.
For a HubSpot report, the About this report tab identifies its description and properties. Use that information when reviewing a pre-built report, so the fields behind its figures are understood rather than inferred from its title.
Understand joined-report populations
In a report combining record types, the primary data source sets the report’s focus; secondary sources relate to it and can affect which records are returned. Before interpreting the total, check that the primary source matches the entity the report is meant to count or value.
HubSpot’s custom report builder provides data-join information showing how sources are connected and which records are included or excluded. Its preview table and available-record count can help reviewers test whether the selected relationships fit the reporting question before relying on the result.
Check and present the result
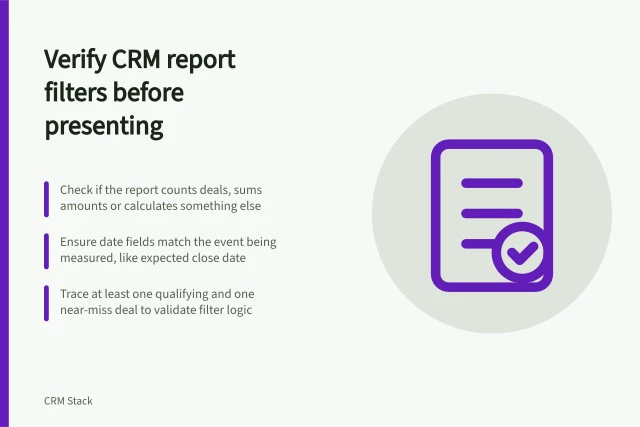
Before sharing a report, trace representative deal IDs from their records to the displayed result. Check the total against the underlying deal list and inspect whether a deal appears more than once when related records are included. HubSpot’s custom report builder documents that data-source choices can affect the data returned.
Check the view available to the intended audience. Permissions may affect which records or forecast values someone can see. Check the refresh point where the product provides one: Dynamics 365 Sales displays a forecast’s last successful recalculation time and documents when underlying changes require recalculation.
Give each recurring report an owner and a short definition: purpose, source records, measure, date field, period, currency, filters, refresh point and known exclusions. If a figure changes, distinguish changes to deals from changes to the reporting population or calculation. Use the result to decide what needs attention; correct a figure that cannot be traced to its records before relying on it.
For a Dynamics 365 Sales forecast, totals in the grid can be aggregated by user or territory, at each hierarchy level and for each period. If an aggregate differs from expectations, check which fields are configured for that forecast’s aggregation; the displayed values depend on those fields.
A review routine can record whether a forecast was recalculated after relevant changes. Dynamics 365 Sales recalculates immediately for adjustments made on the Forecasts page, while changes to underlying records on the opportunities page or to the forecast hierarchy require a manual recalculation.
In this guide
- Comparing pipeline value with expected revenueCompare full pipeline value, weighted deal value and a period forecast using the same deals, dates and currency.
- Defining a CRM sales forecastDefine a CRM sales forecast by period, deal population, amount basis and owner, then make assumptions and adjustments reviewable.
- Checking report filters before presenting resultsUse a record-level checklist to verify CRM report dates, stages, owners, exclusions, visibility and totals before sharing a result.